As promised, here are my training calendars and other pertinent details about my fitness. As previously (maybe?) mentioned, I have not planned a thing past April. I likely will be moving into some build phases, but I want to race a bunch too, and I actually don't know where I will be living/what I will be doing so it's a little hard to make decisions right now. Anyway, on with the pictures.
 |
| Base training overview |
Hopefully visible is the annual training plan. Things to notice are the weekly hours through each base phase, as well as races starting as soon as Base 2. I don't intend on being fiercely competitive during these early races, but I figured I might as well break up the monotony of base season with some quality. In the past I believe I have peaked at 12 hours in one week. This season I will be attempting to push that up to 14 in Base 3. Oh! I also wrote in some objectives. Testing every 4th week is a must - I always intend on doing this but push it aside. Consistency in training - I have mapped out every week with a what-sport/how-long calendar (below) so I don't have to make it up day to day. Increase volume and listen to my body and stretch - I can honestly say I have not had a time-off injury since grade 10 (horrible shin splints, lasted pretty much all through high school). I want to keep it that way. I've already fallen off the stretching wagon.
 |
| Nov-Dec Weeks |
 |
| Dec-Jan-Feb-March Weeks |
 |
| March-April Weeks |
These are fairly self-explanatory. Note the large weekends and easy Mondays. I understand you old people now. I don't like it.
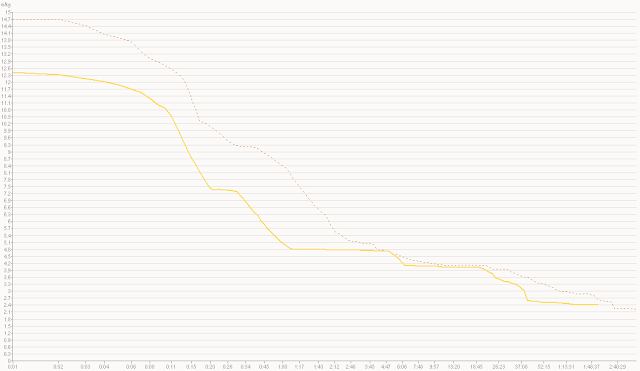 |
| Power to weight vs Time |
I like this chart. Y-axis is my watts/kg, x-axis is duration. Dotted line is maximums from the 2012 season, solid line is this season. As a spoiler for later posts, notice how the lines meet around the 5 and 20 minute marks. These are the two times I test every 4 weeks.
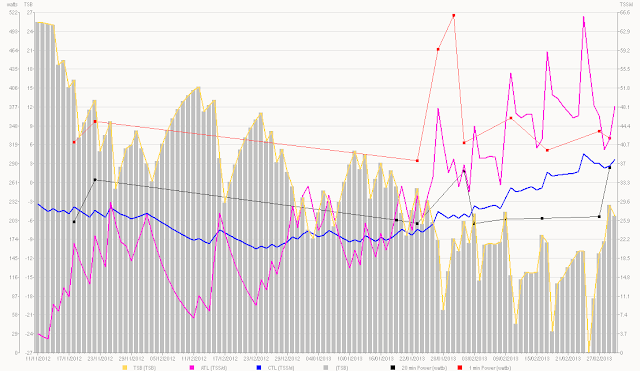 |
| Performance Manager chart |
Another neat chart. WKO+ is a training program that lets you dump all your GPS/power/HR/everything data in, organize it, plot pretty much everything you could ever be interested in, and have it plot things you never knew you could plot. There are some not-so-complex-but-time-consuming-to-explain calculations it does with your running speed and power data based on your functional thresholds that allow it to estimate your training stress volume. Pink line is your acute training stress (over 7 days, accumulated stress), yellow line is essentially your restedness, and the blue line is your overall fitness. Red line with points is top-10 1 minute powers, black line with points is top-10 20 minute powers. Check out the pink line 5x peak-plateau-drop. The last three correspond to 1st, 2nd and 3rd weeks in Base 1. I bet you can guess where Sat-Sun are. Notice also the progressively deeper pits I'm digging myself in the restedness department. However, there is quite a nice rise in overall fitness. I am currently on a rest week, so you can see my restedness climb and my fitness drop a little bit. Acute training stress should also drop quite a bit. This chart only tracks biking and running.
So on the whole, these are the overarching things I use to track and plan my fitness. I will refer to them often from here on out. There isn't much else to say about them, as I am saving the specifics for later posts. If anyone is reading and would like more information, please send me a message or leave a comment. I've never had either happen and I don't know how to tell if it does, but we'll cross that bridge when we get to it.
Adam "A Good Presentation Has More Pictures Than Words" Fortais


No comments:
Post a Comment